Macon’s Inclusive Innovation Ecosystem Dashboard
NETWORK MAP ANALYSIS
This tool displays the inclusive innovation ecosystem of change-makers in Macon, GA. It is intended to be informative to members of the Macon community, both those that participated and those that participate in the ecosystem in other ways.
The network map above displays the organizations within the Macon inclusive innovation ecosystem in traditional network mapping style. The are sized by betweenness centrality (how often they are the connection between other organizations) and colored by the sector in which they operate.
Key Terms and Instructions for Navigating the Map:
Organization Size: The size of an organization within the map corresponds to how “central” they are within the network. This is an organization that is often a common element in relationships or frequently acts as a connection between other organizations. In network analysis, this is known as betweenness centrality, and is measured by the number of times an organization lies on the shortest path between two other organizations.
Connection Strength: Indicated by the thickness of the connecting lines, the connection strength is the level of relationship mutually indicated by the organizations.
0 (No line): Organizations are unaware of each other
1-2 = Organizations are aware of each other but not working together
3-5 = Organizations have a current working relationship of increasing levels of formality
Color: The color of an organization indicates the sector in which the organization primarily operates.
Summary of Network Connectivity
The scrollable graph displays the connectivity of each organization within the network. The longer an organization’s bar is, the more organizations they have at least some level of connectivity with. Left to right across the bar, different levels of connectivity are displayed. If an organization has a large number of active working relationships to other members of the network, they will have a darker, greener bar.
For members of the network: Find your organization in the list.
What does the length of the bar or the breakdown of connection types tell you about how you are interacting within the network?
For ecosystem builders:
What do the profiles of the connectivity of organizations within your network tell you? Can new connections be built intentionally with this knowledge about how organizations are interacting within the network?

Actionable Insights:
Some organizations within the ecosystem, including Macon Black Tech, Be Smart Movement LLc., and SvcSvc had primarily active working relationships within the community, but were not well known outside of those connections.
How can we increase ecosystem-wide awareness within the Macon inclusive innovation ecosystem?
Mercer University had the highest betweenness centrality score in the network, although didn’t have as many connections overall as some other organizations.
How can their position in the network benefit the broader Macon innovation community?
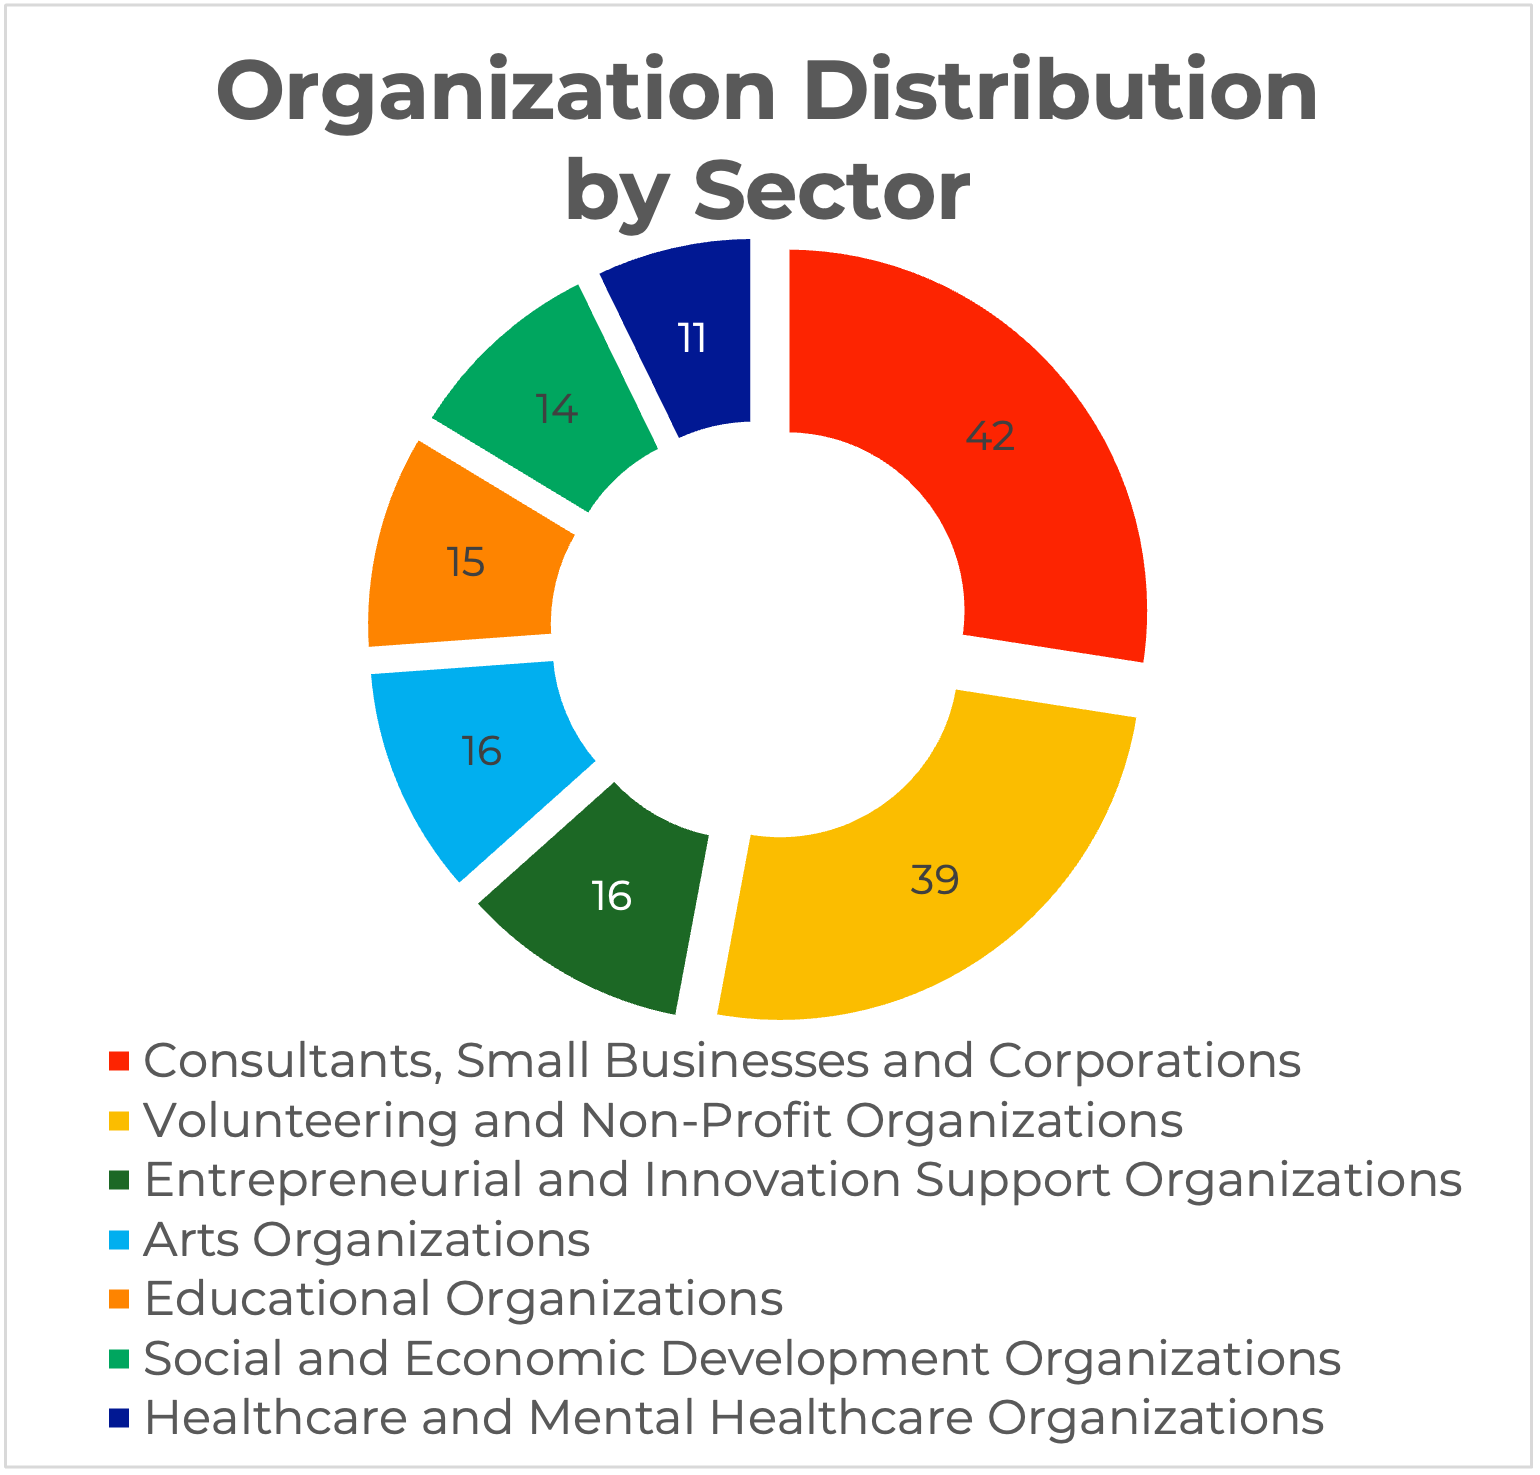
While Entrepreneurial and Innovation Support Organizations only make up 10% of the network (16/153), they made up 30% of the top 10 most central organizations within the network (3/10). Additionally, while Consultants, Small Businesses and Corporations were the largest sector of organizations in the overall network (27%, 42/153), only 1 was present in the top 10 and no Healthcare and Mental Healthcare Organizations were present at all.
How can some of these organizations be drawn more fully into the network?
ECOSYSTEM DESCRIPTIVE DATA
Macon’s Inclusive Innovation Ecosystem network analysis seeks to understand the nature and strength of the change-makers in Macon’s relationships with other organizations in their network, and the value produced by those relationships towards innovation.
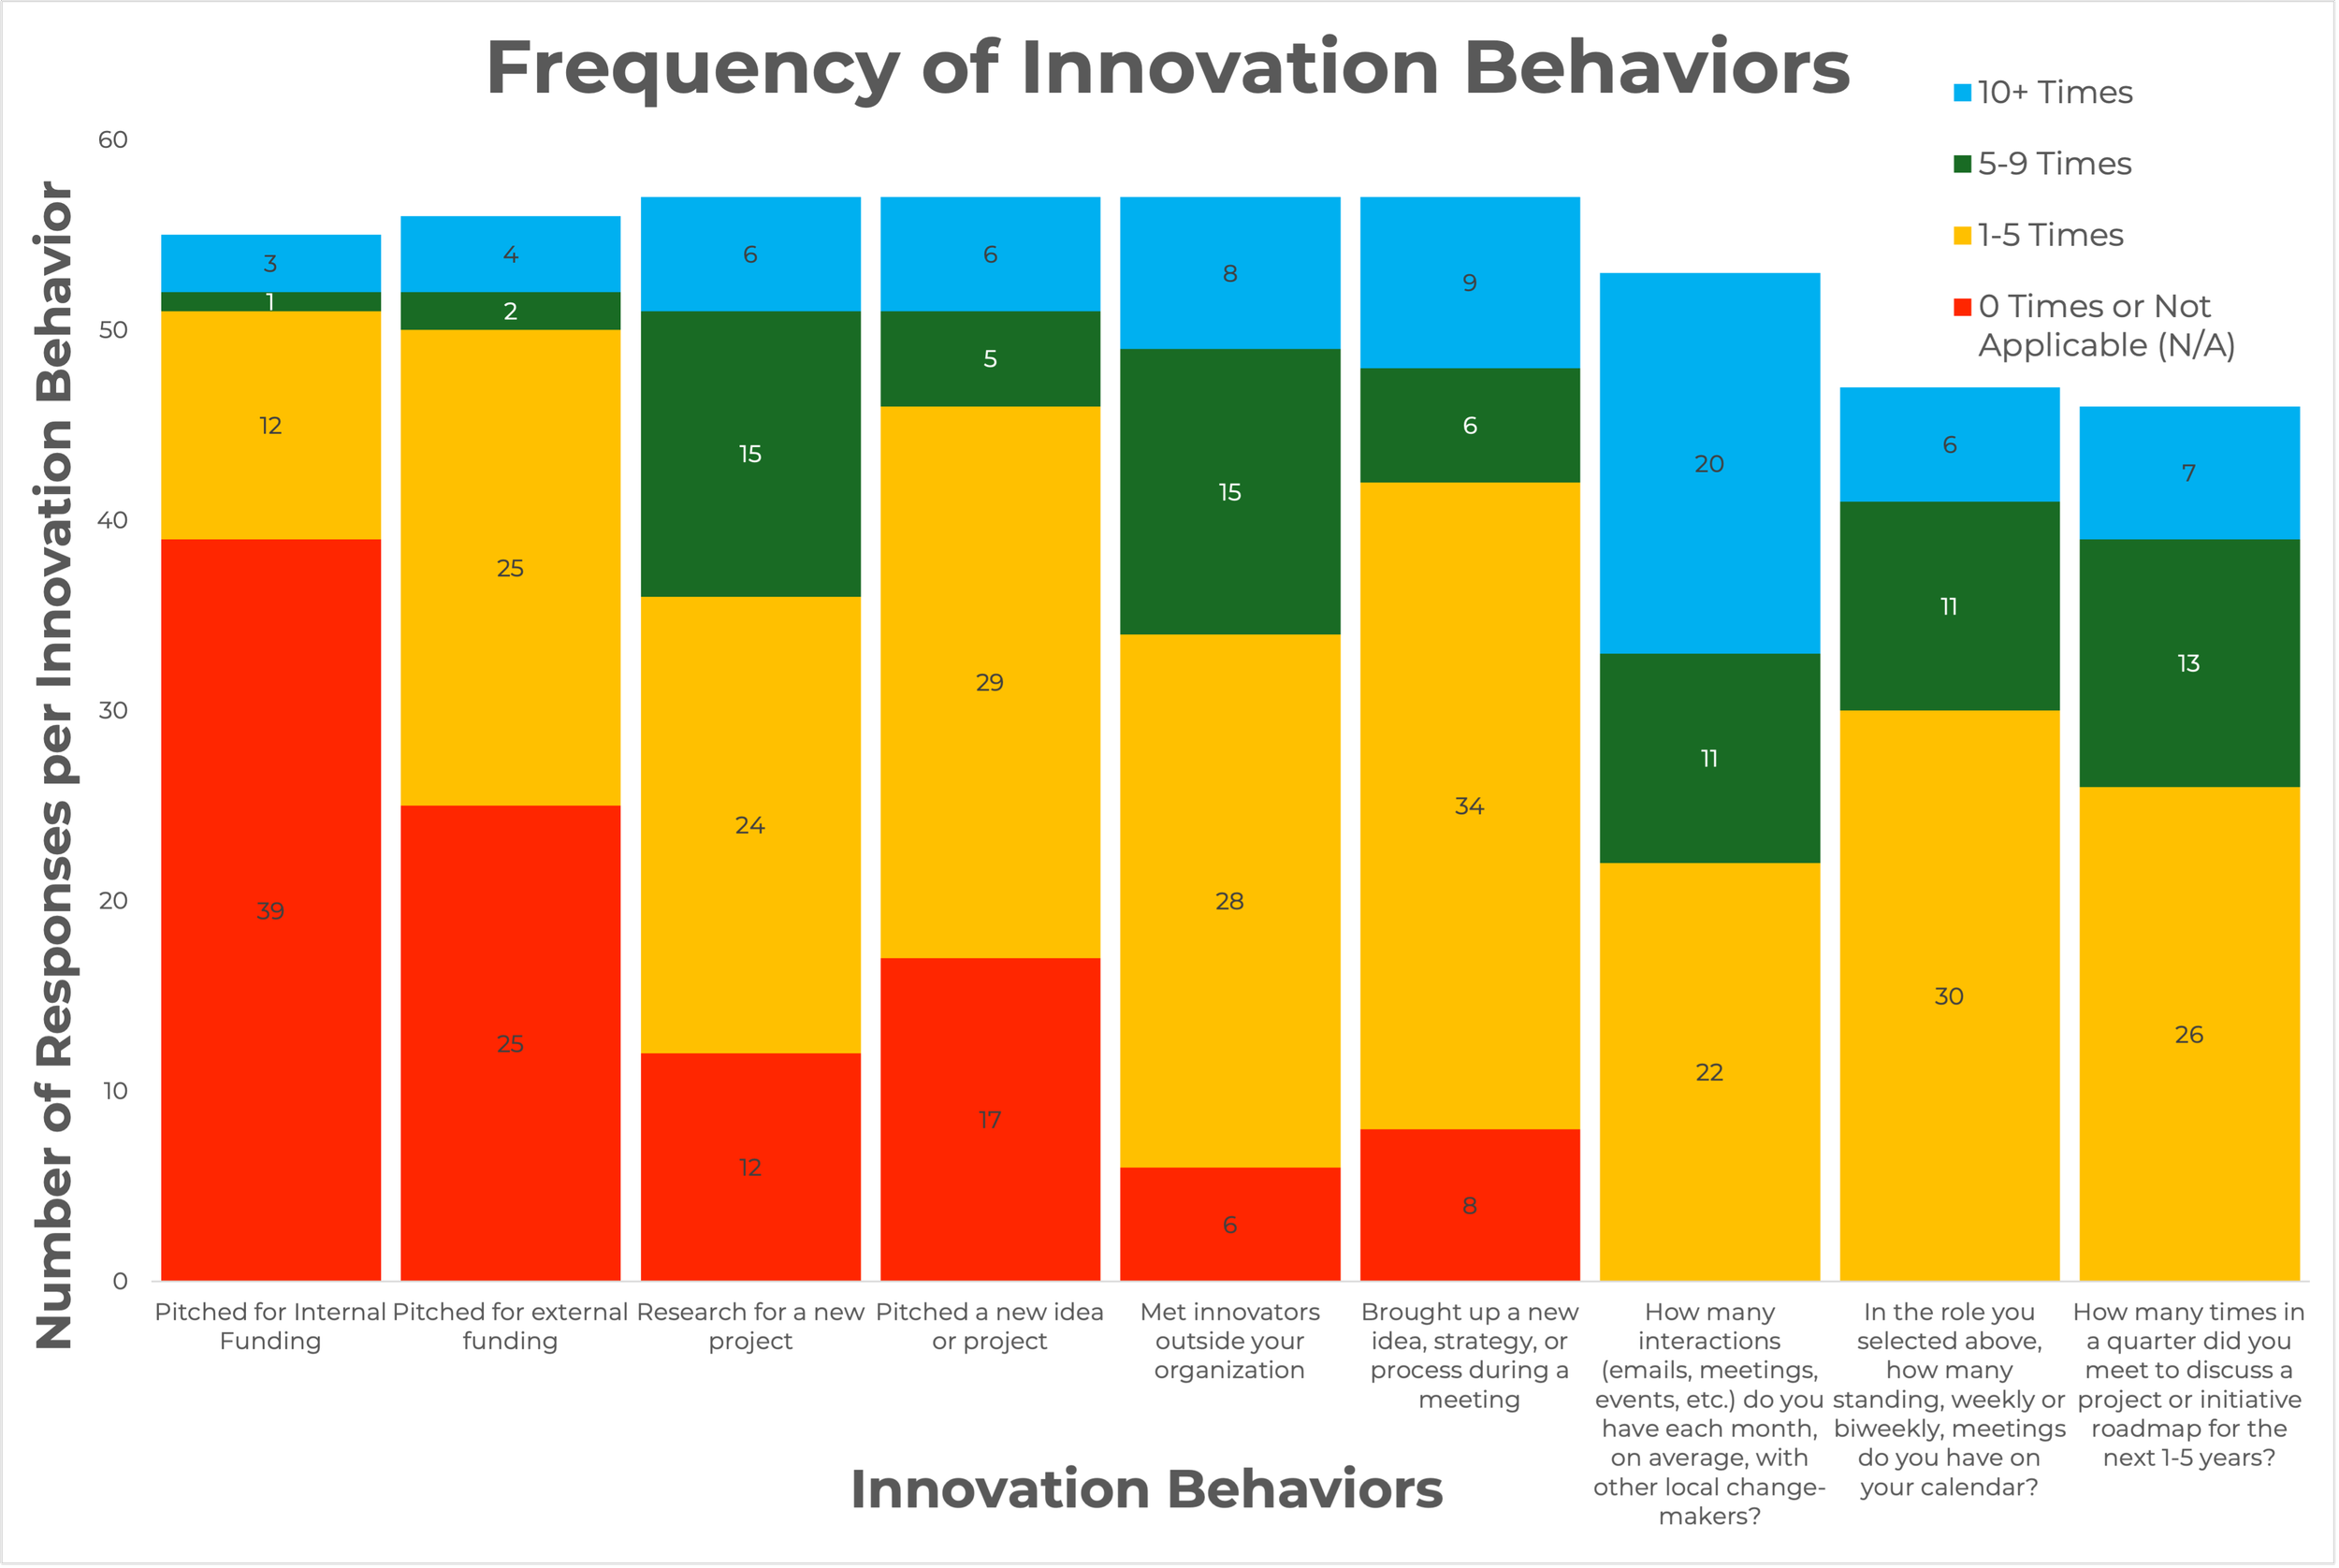
By capturing data on the frequency of engagement, sector, role, and innovation readiness of each change-maker, the Macon residents can clearly identify where their network is strongest, who are their most active participants, and areas for strategic improvement.
3.5/5
Average value participants ranked the inclusive nature of the Macon Innovation Ecosystem
62.5%
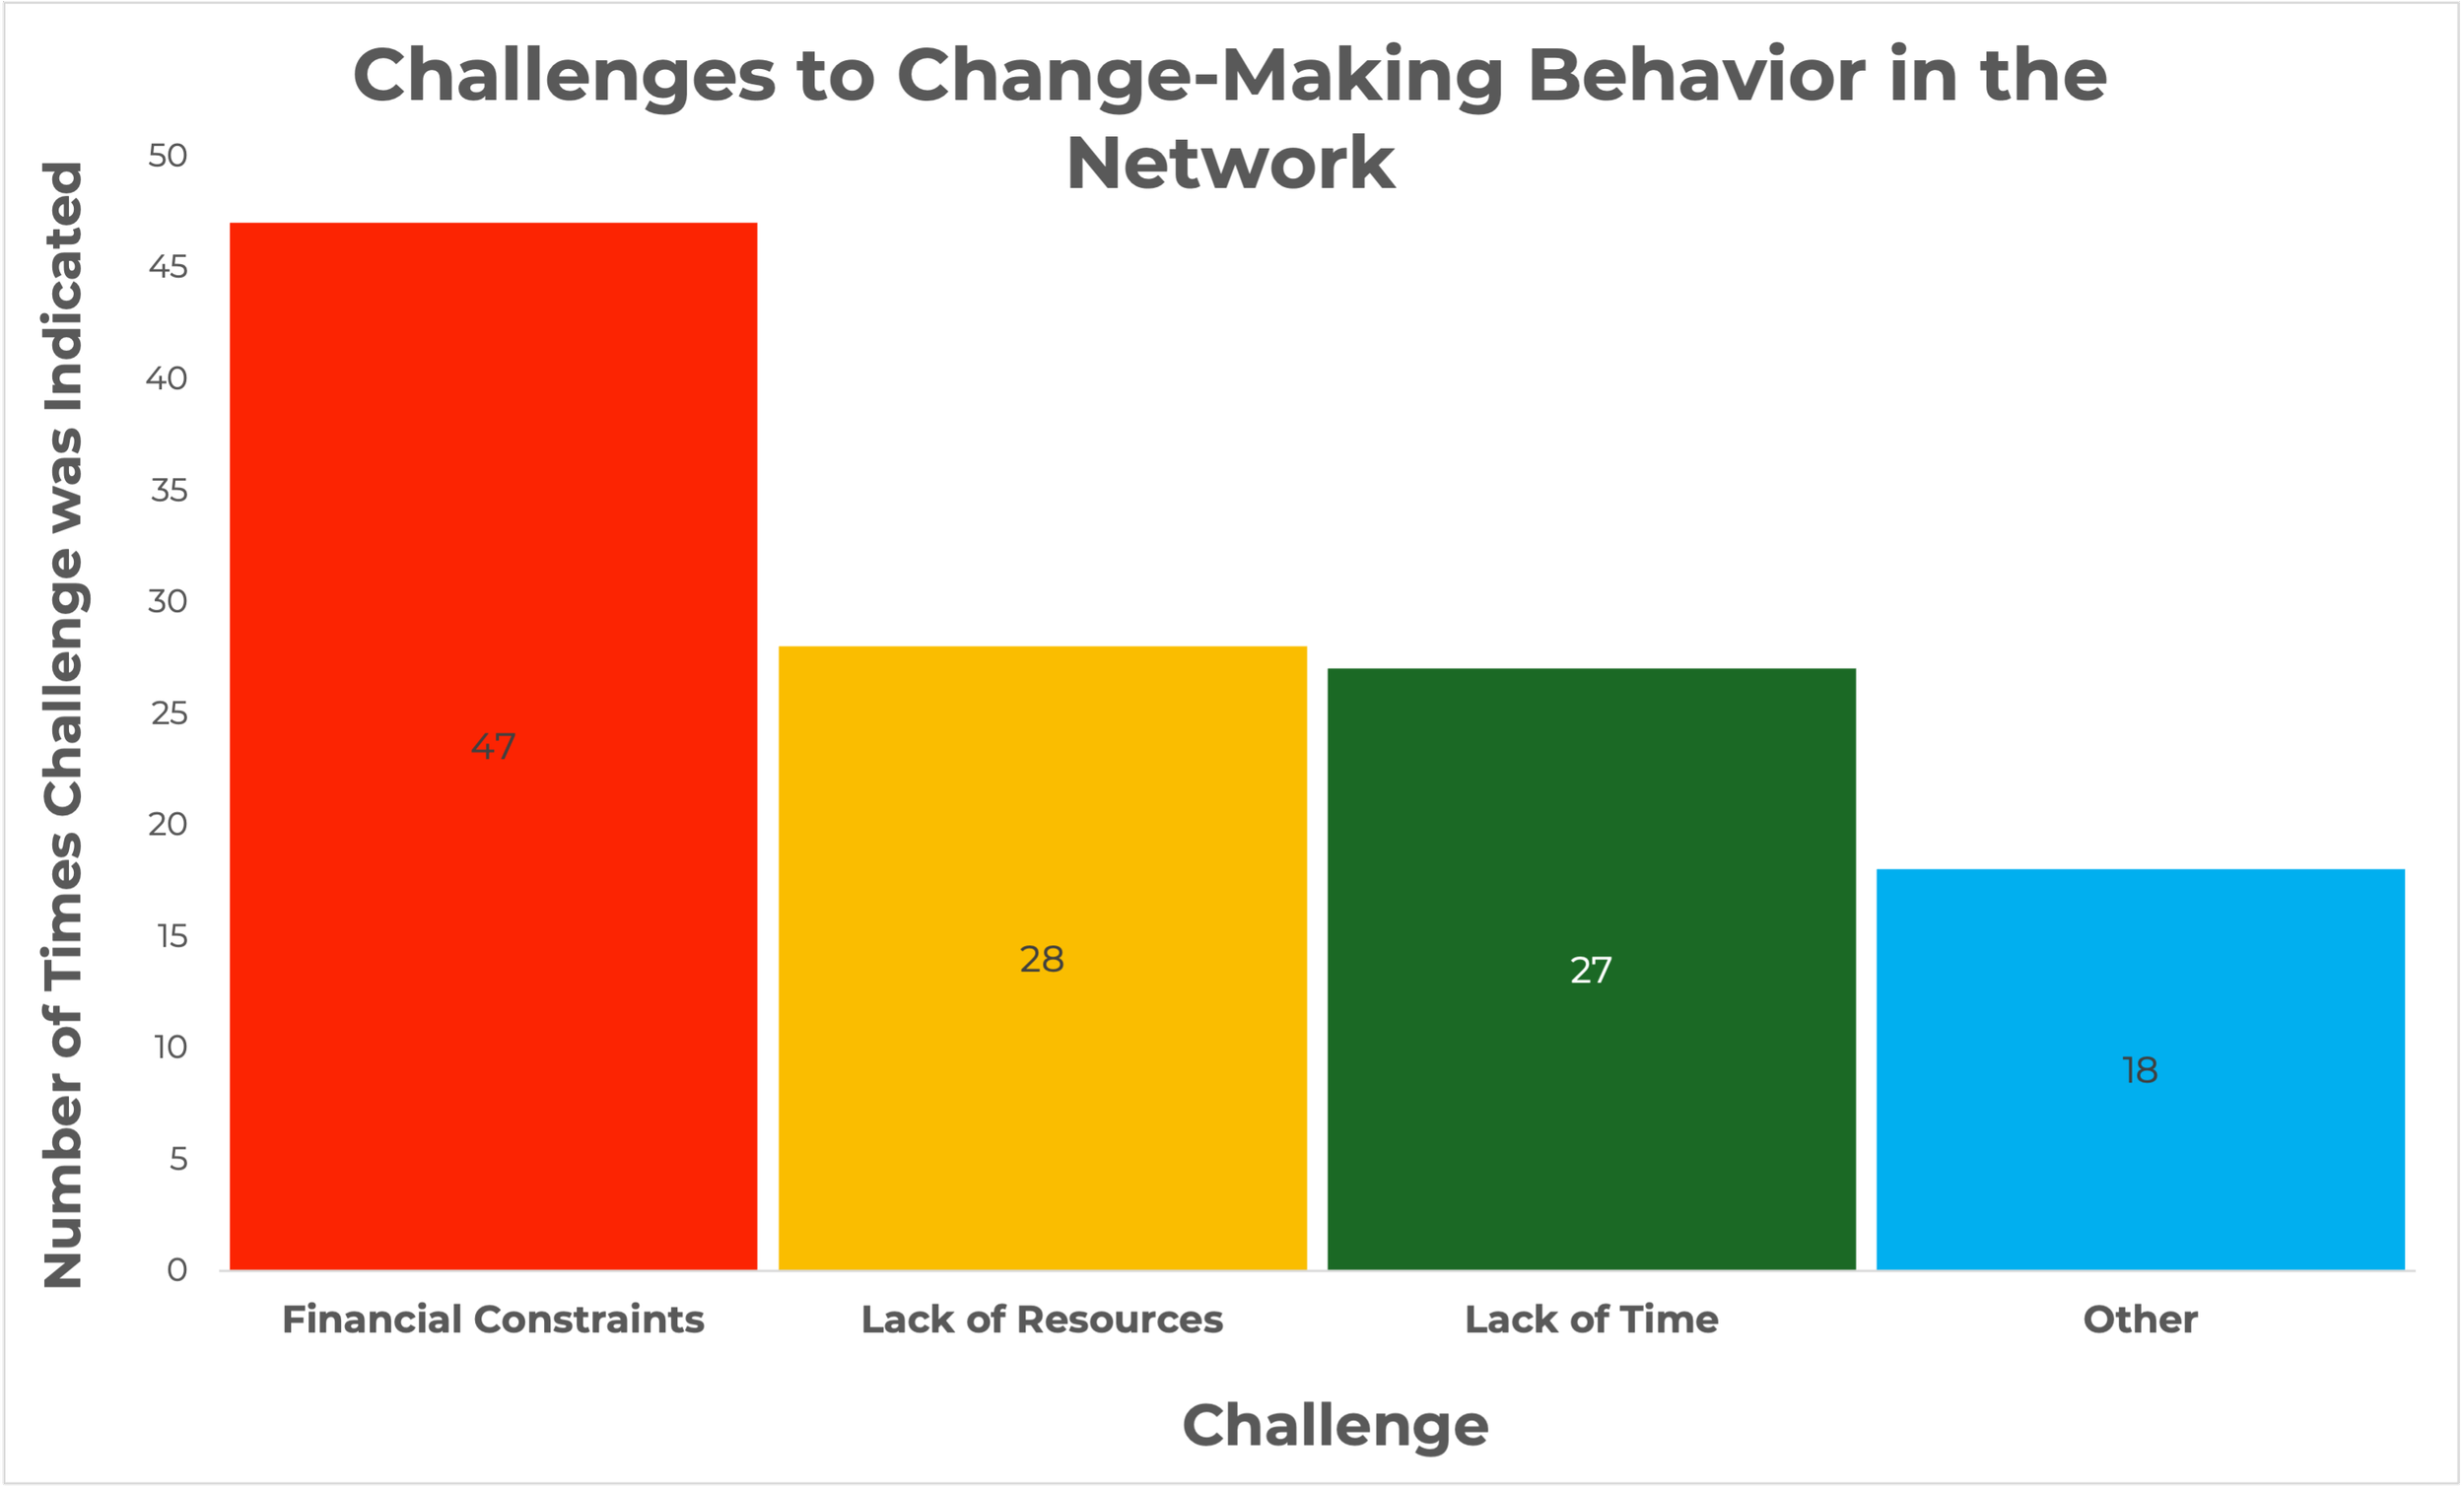
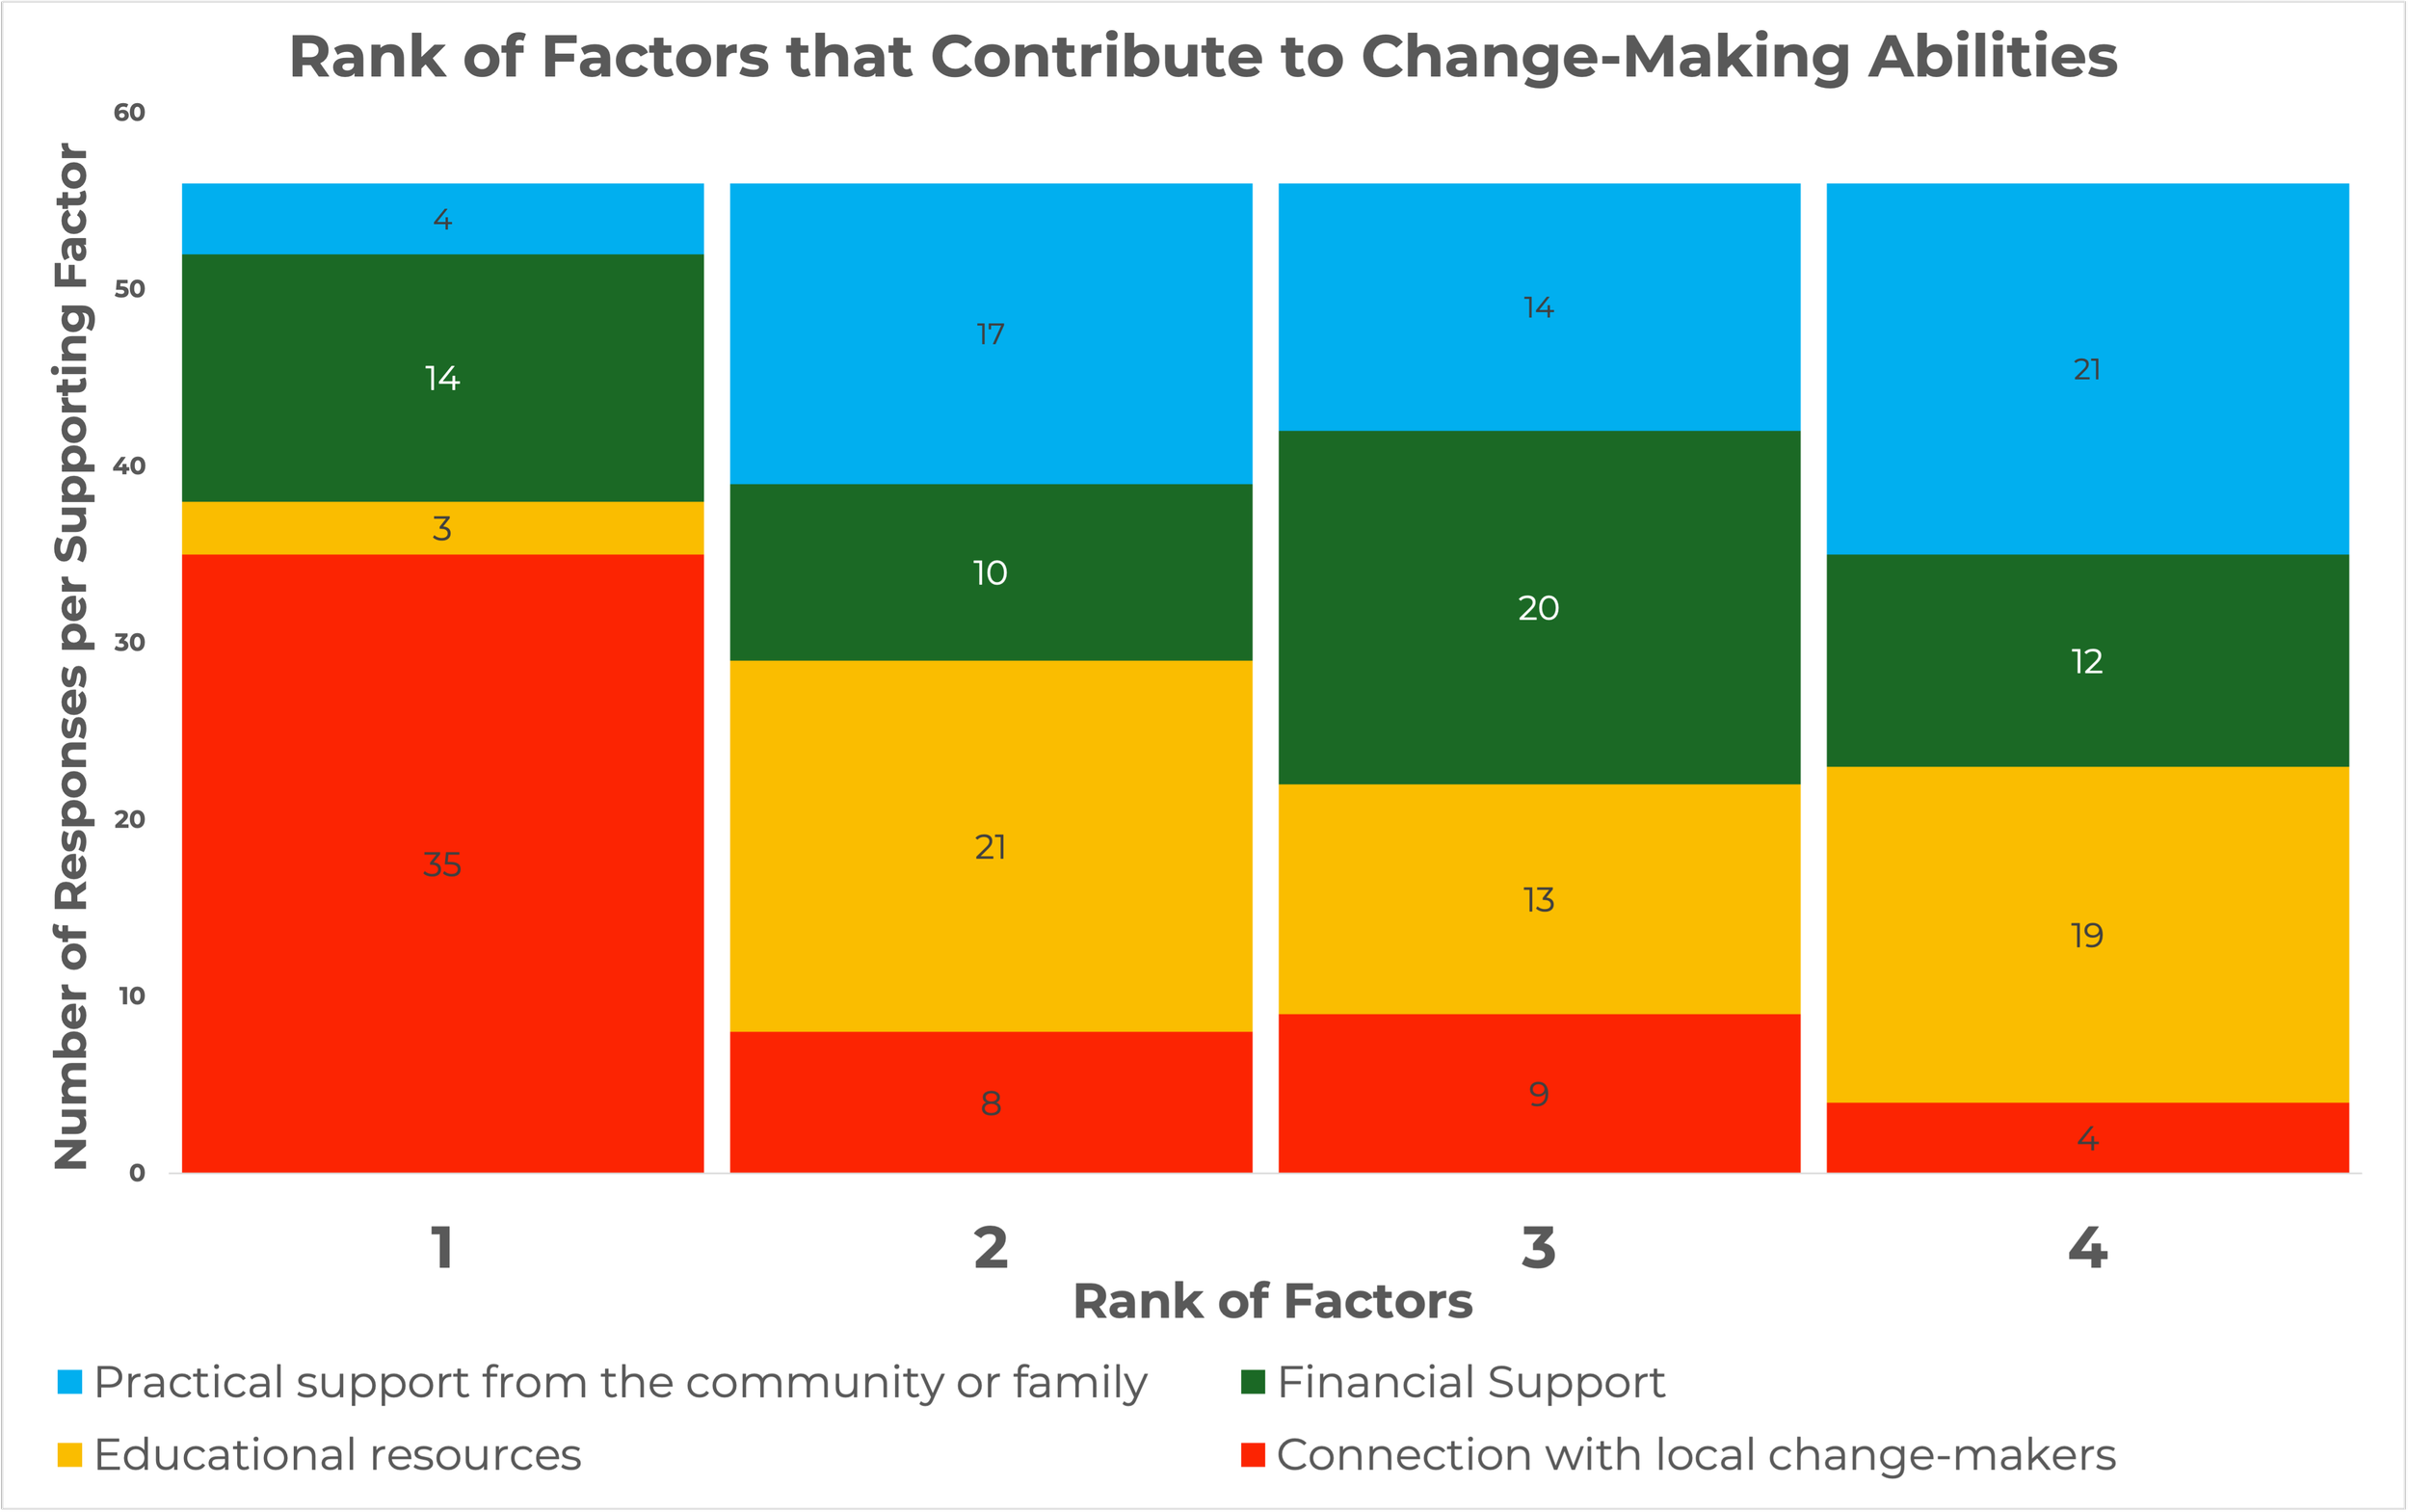
Percentage of respondents who reported that the connections they make with local change-makers is the biggest factor supporting their innovative behavior